SQL Server 2016 Live Query Statistics
The final version of SQL Server 2016 is been out for some time but I haven’t get a chance to talk about some of the new features. So it’s time to take a look at the new features provided by this version, and in this article, I will go through SQL Server 2016 Live Query Statistics.
SQL Server 2014 brought the DMV `sys. dm_exec_query_profiles` to get information about the progress of a running query. Live Query Statistics adds a graphical interface to this DMV. Indeed Live Query Statistics allows seeing the execution plan of a query during its execution.
This execution plan displays the progress of the query processing as well as the execution statistics of each operator such as the number of lines produced, the execution time, etc. Since this data is available in real time, it is easier to understand why some requests are long.
To enable this feature just click on the new button “Include Live Query Statistics”:

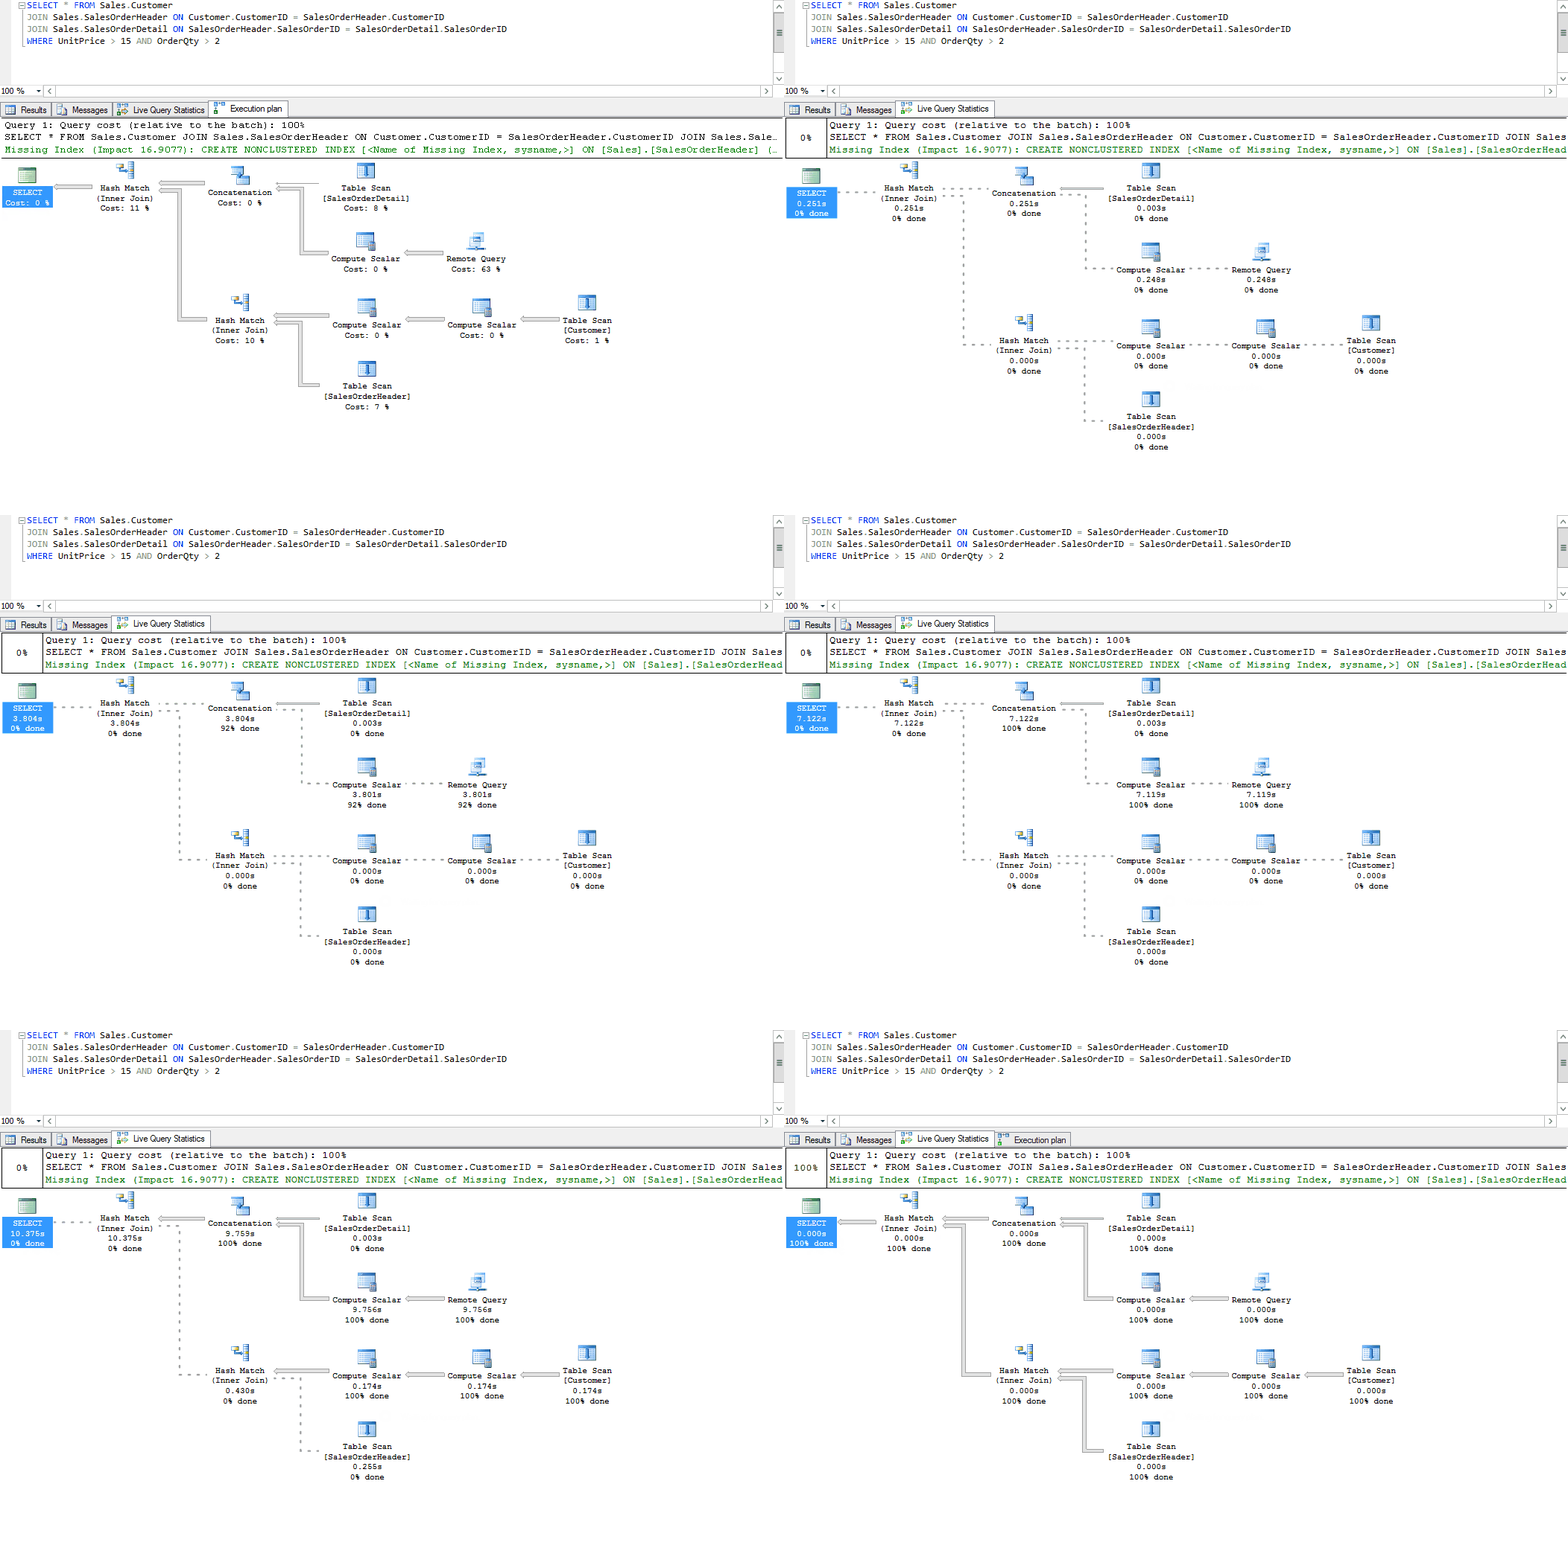
Then during the execution of the query, we see the overall execution plan, as well as the progress of each operation:
- Dashed lines: operations in expectation of execution
- Animated dotted lines: ongoing operations
- Full lines: completed operations

Note that Live Query Statistics does not work with all queries: queries using column store indexes , Memory-Optimized Tables, or native-compiled stored procedures are not supported. This may need to change in the next updates. In addition, this screen adds a small overload of the base operation.
Small flat, queries are generally fast enough but if you like to enjoy the animation you have to run an expensive query 🙂


